The purpose of volume analysis is to understand market movements in advance by highlighting possible support or resistance levels or, more generally, possible market pivot points
TPO Profile (a.k.a market profile®) is part of a set of indicators for volume analysis essential to understand market movements in advance. This set also includes the Volume Profile, Volume Ladder (footprint), Market Depth Map (heatmap), Volume Bubbles, Volume Delta, VWAP, Volume-Meter, Volume on Bid/Ask, Session Statistics and others.
Most of these indicators show the volume traded across the various price levels, highlighting buyers and sellers.
TPO Profile is similar to volume profile. Time-Price-Opportunity (TPO) shows the price distribution during the specified time and highlights at which levels the price has spent the most time. TPO profile is generally used in conjunction with volume profile to better identify areas of support and resistance.
Types of TPO Profiles available
In Overcharts there are different types of TPO Profiles to use depending on the indicator frequency: x sessions, days, weeks, months, or years.
TPO Profile – Session
It allows you to build a TPO Profile for each trading session
You can set up to 2 different sessions in the indicator configuration (Session #1 and #2). This allows you to build two different TPO Profile sequences within a single indicator: one, for example, based on ETH session and the other on RTH session.
- RTH: (Regular Trading Hours) represents the regular trading hours, in other words the hours when the market is actually open
- ETH: (Extended/Electronic Trading hours) represents the entire daily trading session
Example with RTH and ETH sessions set:
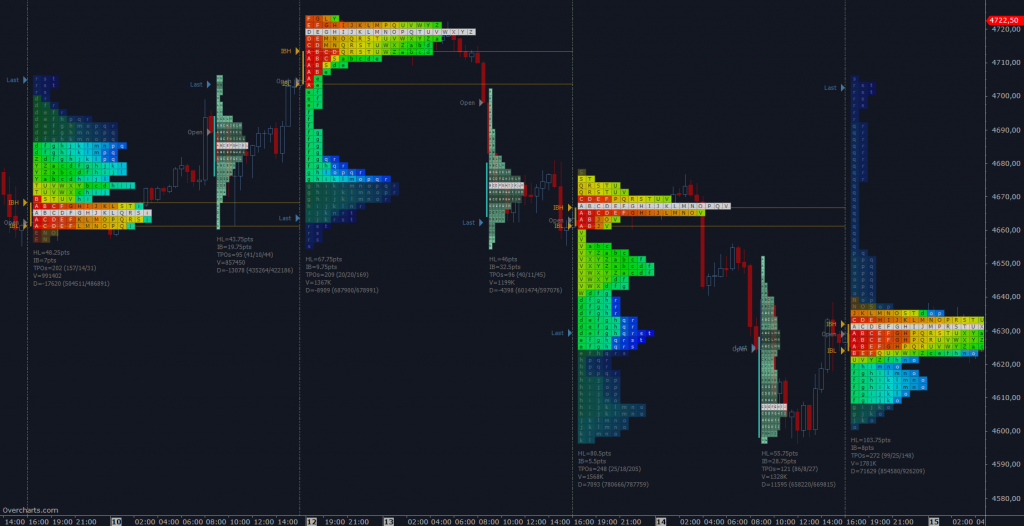
TPO Profile Session can ONLY be used on charts with intraday resolutions
TPO Profile – Long Term
It allows you to build a TPO Profile with a frequency of x days, weeks, months or years
For example, use this indicator to build a TPO Profile for each bar on a daily chart by setting TPO Profile frequency equal to 1-Day:
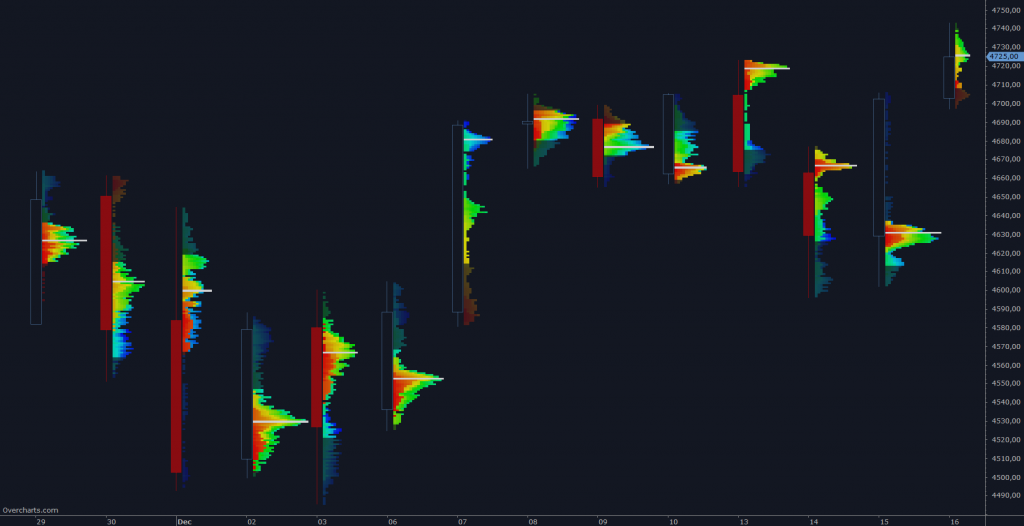
or a weekly TPO Profile on a daily chart:
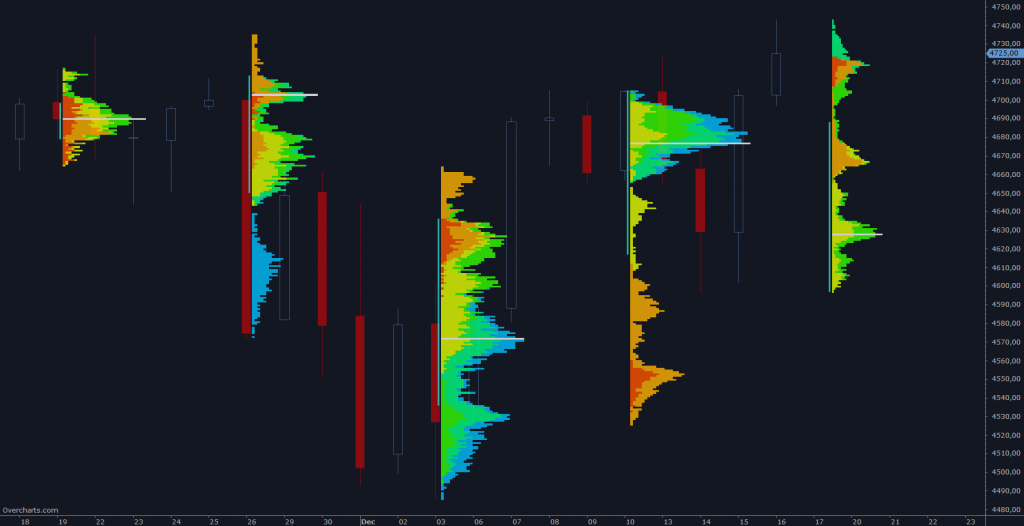
You have infinite combinations between chart and indicator frequency. The only limitation is that the chart must have a resolution less than or equal to the TPO Profile frequency. To be clear, you CANNOT build a 1-day TPO Profile on a 1-week resolution chart.
TPO Profile & Volume Profile
Often TPO Profile and Volume Profile are used together. Add the two indicators to the same chart and set their position correctly:
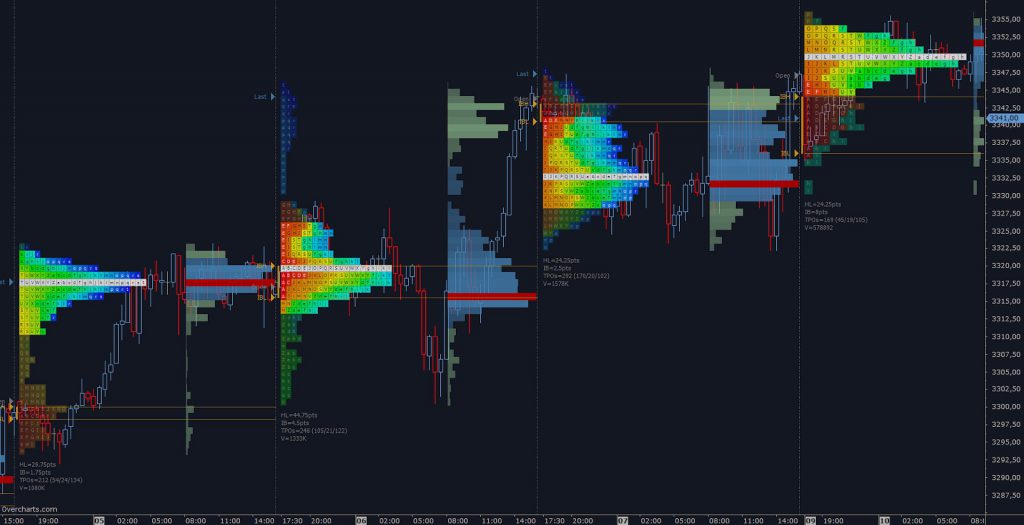
Style Tips
1. TPO-Profile can be displayed aggregated or divided into columns corresponding to the defined Time-Bracket. Particularly useful when Time-Bracket and reference chart resolution coincide:
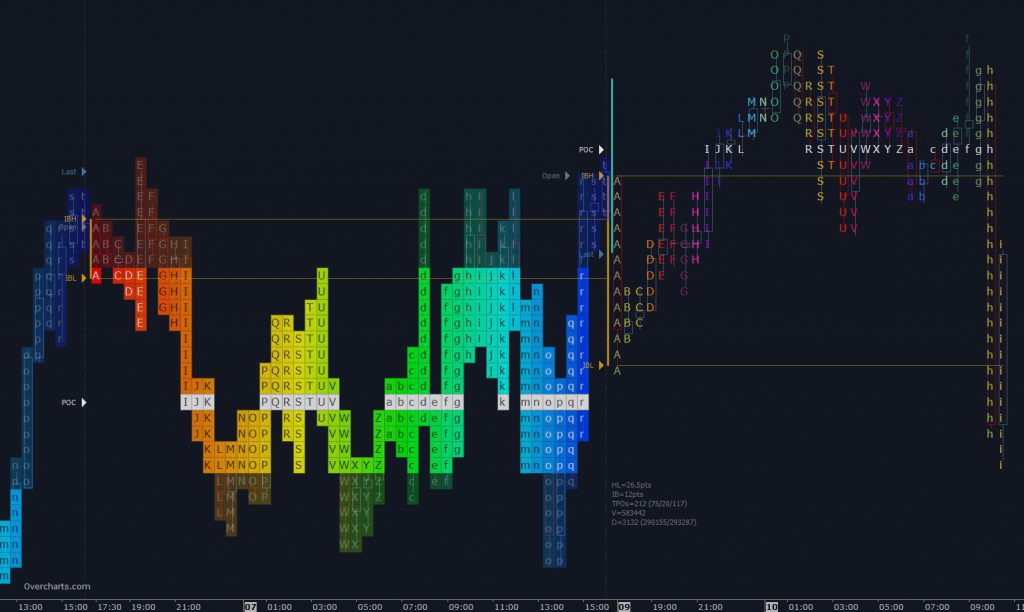
2. If TPO Profile is drawn on each bar, set the space between bars appropriately to optimize the display:

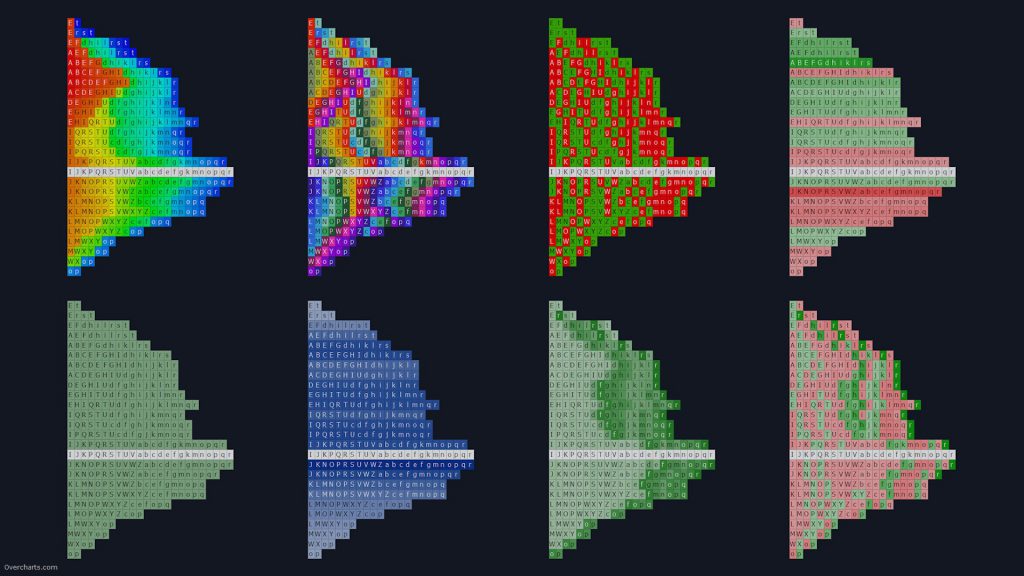
3. Choose TPO-Profile color according to the study or information you want to highlight:
Heatmap: TPOs are colored with a different shade based on their position within the trading session (Trading Hours)
Single Color: entire Profile is colored using a single color
Multiple Colors: TPOs take on a different color according to the Time-Bracket they belong
UpDown TPO-Profile: Profile is colored according to the Open/Close values of entire Profile
UpDown Bar-Range: TPOs are colored according to the Open/Close values of Time-Bracket they belong
Volume TPO-Profile: entire Profile is colored according to the profile total-volume in relation to the other TPO-Profiles displayed
Volume Price: Profile is colored according to the volume of each single price level (similar to Volume Profile)
Volume Bar-Range: TPOs are colored according to the volume traded in the Time-Bracket they belong
Delta TPO-Profile: entire Profile is colored according to the profile delta in relation to the other TPO-Profiles displayed
Delta Price: Profile is colored based on delta of each single price level compared with delta of the other price levels (similar to Volume Ladder indicator)
Delta Bar-Range: TPOs are colored according to the delta of Time-Bracket they belong
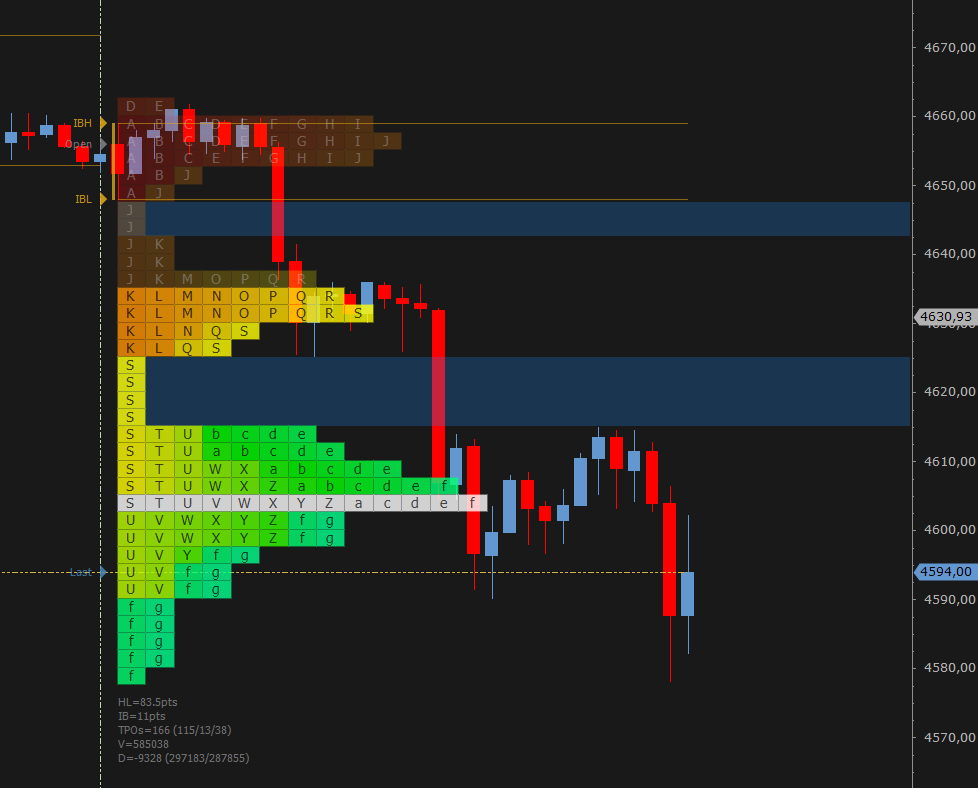
4. Highlight Single Prints on chart to better display price levels containing only 1 TPOs. Single Prints indicate that market has moved too fast in that area and prices will most likely tend to return to those levels in the future.
FREQUENTLY ASKED QUESTIONS
Not enough data to draw the object
If a message similar to Not enough data to draw the object appears in the TPO Profile status line within the chart:
- make sure you are connected to your data feed. If you are not connected to the data feed, data cannot be downloaded
- if you are connected to the data-feed and are using 1-Tick data to build the indicator, then your data-feed probably does NOT provide 1-Tick resolution historical data. In this case you cannot build a TPO Profile using 1-Tick data (better resolution), but you must use 1-Minute data by correctly setting Resolution property in the indicator configuration.
TPO Profile is drawn on an incorrect time interval
If TPO Profile is drawn on an incorrect time interval, check that you have set the right session in relation to the underlying instrument. Session is a FUNDAMENTAL parameter for the TPO Profile calculation! Set the session correctly in the indicator configuration.
Partial TPO Profile
If you notice a lack of data in the chart, or a partial TPO Profile:
- make sure you are connected to your data feed. If you are not connected to the data feed, data cannot be downloaded
- if you are connected, it is most likely a temporary data feed issue regarding the availability of historical data. Follow these instructions to download data
Grouping multiple price levels
For some instruments, where the tick-size is very small compared to the current price (typical of US stocks), it may be necessary to group a number of price levels into one level. Correctly set the Ticks for Row property in the indicator configuration.
Volume not avalilable or not reliable
Unfortunately you CANNOT build the TPO Profile on all instruments. Some instruments (such as most of Forex CFDs) have not Volume, or Volume is NOT a reliable data. For this reason you cannot build a TPO Profile on this type of instruments, or it does not make much sense to do that.
Letters are not displayed
Letters are displayed if there is enough vertical space to draw them. If price levels are too small (height), letters are not shown. You have 2 possible solutions:
- Zoom-in on the Y-axis until letters appear
- or set Ticks per Row property to a value greater than 1 (such as 10). Try to see which value is best for you and the instrument. This way you will group multiple price levels into one and the vertical space available for letters will be greater

Post a Comment